
Decoding Chart Patterns: A Systematic Approach to Advanced Technical Analysis
Welcome to the world of technical analysis, where Chart Patterns play a pivotal role in shaping trading strategies. This is an ultimate guide designed to help users objectively identify the existence of Chart Patterns, define the characteristics and classify them. In this discussion, we will mainly concentrate on
Understanding Chart Patterns
Chart patterns are visual representations of price movements on a chart, which can help traders identify potential trading opportunities. These patterns are formed by the interaction between supply and demand in the market and can indicate the continuation or reversal of a trend.
There are various types of chart patterns, including:
- Trend Continuation Patterns: These patterns suggest that the current trend is likely to continue in the same direction. Examples include the flag pattern, pennant pattern, and triangle pattern and all other trendline pair based patterns that we are going to discuss today
- Consolidation Patterns: These patterns suggest a period of indecision in the market, where the price is range-bound. Examples include the rectangle pattern, symmetrical triangle pattern, and ascending/descending triangle pattern.
- Trend Reversal Patterns: These patterns indicate that the current trend is likely to reverse. Examples include the head and shoulders pattern, double top pattern, and double bottom pattern. These patterns also include rising and falling wedge type of patterns that are based on trendline pairs
Instruments and Timeframes for Applying Chart Patterns
Chart patterns can be applied to a wide range of financial instruments and timeframes. Here are some considerations for applying chart patterns:
Instruments:
- Stocks
- Forex (Currency Pairs)
- Commodity and metals
- Indices
- Cryptocurrencies
Timeframes:
- Intraday (e.g., 1-minute, 5-minute, 15-minute)
- Short-term (e.g., hourly, 4-hourly)
- Medium-term (e.g., daily, weekly)
- Long-term (e.g., monthly, quarterly)
It is important to note that the effectiveness of chart patterns may vary depending on the instrument and timeframe. Traders should consider the characteristics and volatility of the specific instrument and choose the appropriate timeframe for their trading strategy.
Basic Principle of Identifying the Chart Patterns
It is crucial to apply a definitive set of rules when identifying chart patterns to avoid biases or fitting them to our opinions. To understand the risks of overfitting chart patterns to our bias, please visit our other blog post on overfitting chart patterns.
To objectively identify chart patterns, it is important to establish ground rules or follow a well-defined technique. Here is the technique we employ to identify chart patterns.
Step 1 - Apply Zigzag indicator on the chart
Tradingview has plenty of free community scripts for Zigzag indicator. For this demonstration, we are going to use our Recursive Zigzag implementation.

Once the indicator is loaded on the chart, goto indicator settings and perform these modifications.
- Disable the Labels : The Labels contain information that is needed for this exercise.
- Set the Highlight level to 1 or 0 : We can iteratively increase the level and check next levels on the go.
You can also adjust Zigzag Length and Depth Parameters.

Step 2 - On each level, mark the last 5 zigzag pivots.
For example, in today's BTCUSDT 1h chart, level 0 zigzag of Length 5 is displayed as below where we have marked last 5 Zigzag pivots.

Step 3: Draw trendlines
As part of this step, draw two trendlines.
- The first trendline will join pivots 1 and 5 marked in the previous step.
- The second trendline will join pivots 2 and 4 marked in the previous step.

Step 4: Inspect and identify if there is a Chart Pattern
On visual inspection, this looks like a Diverging Triangle Chart Pattern. However, the only issue is that pivot (3) is nowhere near the trendline. This makes the upper trendline not reliable, and so is the derived Chart Pattern.

Step 5: Repeat the process on next zigzag levels
You may not find any Chart Patterns on the base zigzag level. However, repeat the process on next zigzag levels.
On further inspection, we identified a valid Chart Pattern on the level 3 zigzag.

From visual inspection, this can be either a "Ranging Channel Chart Pattern" or "Uptrend Channel Chart Pattern" or "Expanding Rising Wedge Chart Pattern". You can apply further rules on the trendline slopes to determine which category the Chart Pattern falls into.
Please note that Pivot (3) may not touch the trendline at the exact point. Keep certain threshold to allow minor deviations.
Using Last 6 Pivots
Above is the demonstration of using last 5 pivots for scanning the Chart Patterns. Similarly, we can also use last 6 pivots. Using 6 pivots will yield lesser number of Chart Patterns and also geometrically more accurate Chart Patterns.
When using 6 Pivots, we need to inspect both pivot 3 and 4 are part of the opposing trendlines. In short, Pivots 1, 3, 5 should form a trendline where no candles should violate them. It is fine if the candles touch the trendlines. But, they should not fall outside the trendline pairs. Similarly, Pivots 2, 4, 6 should form a trendline, where not candles are violating them.

Classification of Chart Patterns
Once the Chart Patterns are identified, they need to be classified into different types. We need to apply predetermined rules to objectively classify Chart Patterns into what they are. Everyone can build their own rules.
Properties of Derived trendlines
Before classifying the trendlines, we need to understand below properties of the derived trendlines.
Direction of Individual trendlines
Both the trendlines needs to be individually classified among these categories
- Rising - trendline is sharply rising up.
- Falling - trendline is sharply falling down.
- Flat - trendline is flat across the pivots.
- Bi-Directional - trendlines are moving in opposite directions
Please note that, it is less probable for trendline to absolutely flat. Hence, allow angle to have certain degree of threshold to be considered as flat. For example, +- 10 degrees can be considered as flat.
Also, the angle of the trendline can further subjective based on how compressed the chart is. It is recommended to use either log/auto-scale or a specific formula based on ATR to identify the angle.
Characteristic of the trendline Pairs
This parameter defines how both trendlines are aligned with respect to each other. Possible options are:
- Converging - trendlines are converging and when extended towards the right will intersect at a visible distance.
- Diverging - trendlines are diverging from each other and when extended towards the left will intersect at a visible distance.
- Parallel - trendlines are almost parallel to each other and may not intersect to either right or to left at a visible distance.
To objectively identify the intersection distance, we further need to use some standard. Here are few options
- Fixed Number of Bars: If the trendlines do not intersect to either left or right within X bars (Lets say 100), they can be considered as parallel. Otherwise, they can be classified as converging or diverging based on which side the intersection happens.
- Relative to the Length of the Chart Pattern: If the length of longest trendline is X bars. The trendlines should converge within 1–2 times the X bars to be considered as converging or diverging. Or else, it can be termed as parallel channels.
Geometrical Shapes Classification
Following are the main geometrical classifications
- Channels - trendlines are parallel to each other. And hence they both move in the same directions.
- Wedges - trendlines are either converging or diverging from each other. However, both trendlines move in the same direction. Both trendlines will be either up or down.
- Triangles - trendlines are either converging or diverging from each other. But, unlike wedges, upper and lower trendlines will have different direction.
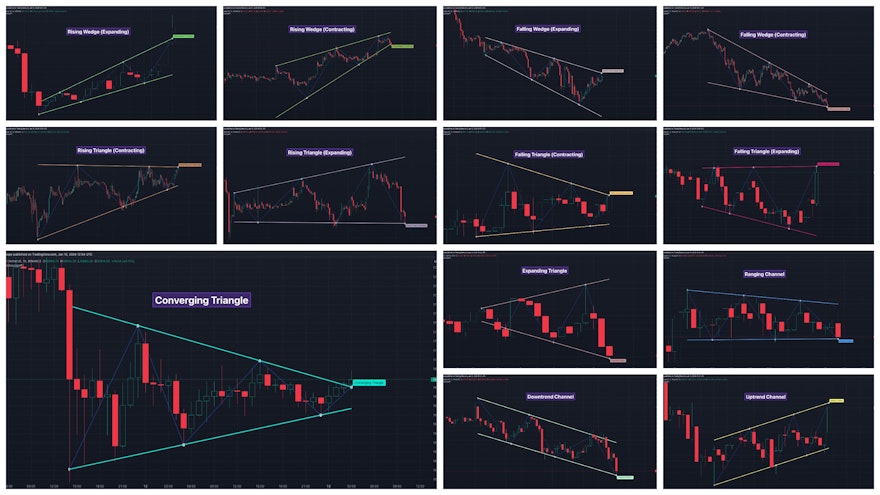
Types of Chart Patterns
Once we identify the direction and characteristics of trendlines, we can go on and classify the Chart Pattern in following categories. Each pattern has its own generic bias. For example, Rising Wedge patterns are considered bearish whereas Ascending Triangle Patterns are considered bullish. However, Converging Triangle and channels are considered bilateral patterns. However we will not discuss the trade directions as part of this article.
Rising Wedge Chart Pattern(Contracting)
Rules for Contracting Rising Wedge Chart Pattern are as follows:
- Both trendlines are Rising
- trendlines are converging.

Rising Wedge Chart Pattern(Expanding)
Rules for the Expanding Rising Wedge Chart Pattern are as follows:
- Both trendlines are rising
- trendlines are diverging.

Falling Wedge Chart Pattern (Contracting)
Rules for the Contracting Falling Wedge Chart Pattern are as follows:
- Both trendlines are falling
- trendlines are contracting.

Falling Wedge Chart Pattern (Expanding)
Rules for the Expanding Falling Wedge Chart Pattern are as follows:
- Both trendlines are falling
- trendlines are diverging.

Contracting/Converging Triangle Chart Pattern
Rules for the Converging Triangle Chart Pattern are as follows
- The upper trendline is falling
- The lower trendline is rising
- Naturally, the trendlines are converging.

Ascending Triangle Chart Pattern(Contracting)
The rules for the Contracting Ascending Triangle Chart Pattern are as follows
- The upper trendline is flat
- The lower trendline is rising
- Naturally, the trendlines are converging towards each other

Descending Triangle Chart Pattern(Contracting)
The rules for the Contracting Descending Triangle Chart Pattern are as follows
- The upper trendline is falling
- The lower trendline is flat
- Naturally, the trendlines are converging towards each other

Expanding/Diverging Triangle Chart Pattern
Rules for the Diverging Triangle Chart Pattern are as follows
- The upper trendline is rising
- The lower trendline is falling
- Naturally, the trendlines are diverging from each other.

Ascending Triangle Chart Pattern(Expanding)
The rules for the Expanding Ascending Triangle Chart Pattern are as follows
- The upper trendline is rising
- The lower trendline is flat
- Naturally, the trendlines are diverging from each other

Descending Triangle Chart Pattern (Expanding)
The rules for the Expanding Descending Triangle Chart Pattern are as follows
- The upper trendline is flat
- The lower trendline is falling
- Naturally, the trendlines are diverging from each other

Ascending/Uptrend Channel Chart Pattern
Rules for the Uptrend Channel Chart Pattern are as follows
- Both trendlines are rising
- trendlines are parallel to each other

Descending/Downtrend Channel Chart Pattern
Rules for the Downtrend Channel Chart Pattern are as follows
- Both trendlines are falling
- trendlines are parallel to each other

Ranging Channel Chart Pattern
Rules for the Ranging Channel Chart Pattern are as follows:
- Both trendlines are flat
- Naturally, the trendlines are parallel to each other.

Free Indicators on Chart Patterns
Here are some of our free and popular indicators on the subject of Chart Patterns
Auto Chart Patterns - Free Version
Our Auto Chart Patterns indicator stands as the epitome of advanced chart pattern recognition technology. Building upon our recent publication on algorithmic identification and classification of chart patterns, this tool embodies our innovative approach, automating the intricate process of pattern recognition for traders.
This algorithm tries to capture chart pattern by drawing trendline pairs for lower and higher pivots. The algorithm is so powerful that it can capture many well-known pattern such as converging and diverging triangles, rising and falling wedges, flags, trend and range channels etc.
There are several implementations of ABC pattern in tradingview and pine script. However, we have made this indicator to provide users additional quantifiable information along with flexibility to experiment and develop their own strategy based on the patterns.
The Wolfe wave indicator is a very popular chart pattern used in options trading. The indicator spots the Wolfe formations and also suggests the rules of the Wolfe wave trading system.
Multi Zigzag Wedge and Flag Finder
Most sophisticated Chart Pattern Indicator you will ever find in the open source library of Tradingview. This indicator uses an advanced multi-zigzag algorithm to spot 5 or 6 pivot chart patterns. This is an earlier version of the Chart Patterns (Deep Search) Indicator
Automatically draw trendlines based on historical price action. Gives headstart for users for drawign trendlines. Useful tool for both experienced and new traders who use trendlines as their trading tool.
The indicator automatically draws pitchfork formations on a recursive zigzag. This algorithm is developed using the latest features of Pinescript of using methods and types. The script has the option to select different categories of pitchforks to be drawn. Popular types include Andrew's pitchfork, Schiff and Modified Schiff pitchforks. These can be further drawn as either regular or inside pitchforks.
Recursive Reversal Chart Patterns
An advanced technical indicator that scans for reversal chart patterns - Double Tap, Triple Tap, Cup and Handle, Head and Shoulder patterns
Consolidation Range Tracker is an innovative indicator designed for identifying and tracking price consolidation zones following impulsive moves.
The Volume Forks Indicator is a comprehensive research tool that combines two innovative techniques, Recursive Auto-Pitchfork and Angled Volume Profile. This indicator provides traders with valuable insights into price dynamics by integrating accurate pitchfork drawing and volume analysis over angled levels.
Are you a firm believer in the predictability of historical patterns guiding market trends? If so, this indicator is tailor-made for you.
Free Indicators on Harmonic Patterns
At Trendoscope, we specialise in design and development of indicators on Harmonic Patterns. Here are some of our indicators on the concepts of Harmonic Patterns.
Auto Harmonic Patterns - Extreme
Auto Harmonic Patterns Extreme indicator is the most advanced free tool available for identifying harmonic patterns in the market. Developed by our team of expert traders and programmers, this indicator uses sophisticated algorithms to scan the market and identify key patterns such as the Butterfly, Gartley, Crab, and Bat patterns.
A very good tool for those who are learning Harmonic Patterns. Makes use of Tradingview's interactive input feature which lets the user select the pivots manually and the indicator will highlight if there are any harmonic patterns in the price action. Makes use of the same libraries as our premium Harmonic Pattern indicators.
Interactive Harmonic Pattern Projection
Similar to Manual Harmonic Patterns but instead of notifying patterns on XABCD pivots, this indicator requests users to select the first 4 pivots XABC and then projects the 5th pivot areas for possible harmonic patterns.
Harmonic Pattern Based Trend Follower
One of the innovative concepts that combine trend following and reversals. This indicator tries to define trends based on harmonic pattern price action.
Harmonic Pattern Based Supertrend
When we talk about Trend Following, we cannot ignore supertrend. Supertrend is one of the most popular trend-following technical indicators. Generally, supertrend is derived by ATR-based stops. In this adventure, we try to derive supertrend based on harmonic patterns reversal levels.