
Navigating the Risks of Overfitting: Avoiding Bias in Chart Pattern Analysis
Chart Patterns are very popular among technical traders and it forms a crucuial for market analysis based on technicals. However, there is a hidden danger lurking in the shadows - the risk of overfitting to fuel our bias rather than framing the patterns objectively.
Understanding Overfitting in Chart Pattern Analysis
Overfitting occurs when a trader draws patterns erratically without any objective rules with the hope of supporting the bias or conclusion which they have already formed based on other means. Here is a classical example of how someone can overfit the patterns to their bias.
There was a post in twitter which marked a particular converging triangle on BTCUSDT chart on 4H timeframe (As shown below) and implying more bearishness ahead as the price has broken downwards. But, is it really correct analysis?
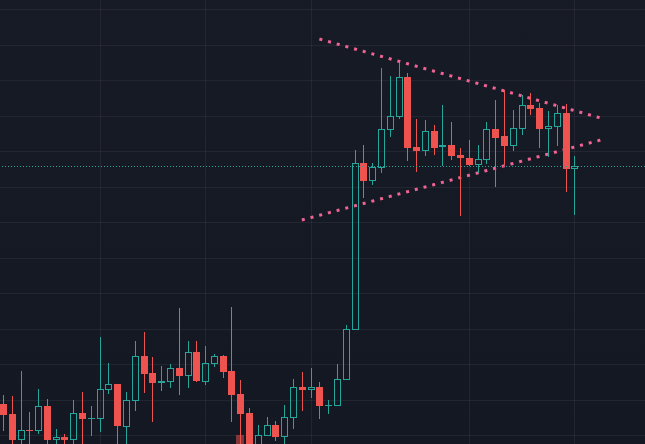
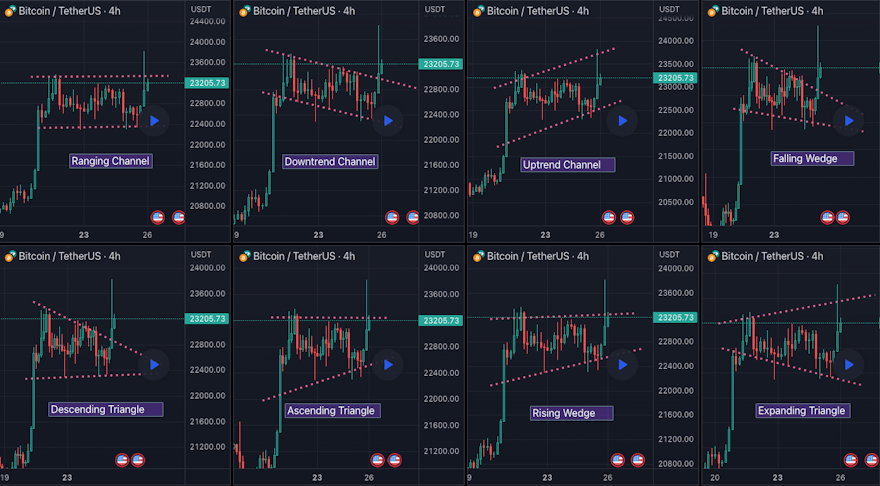
But, if you look closely, you can see that the scenario can be presented as many other patterns as well.
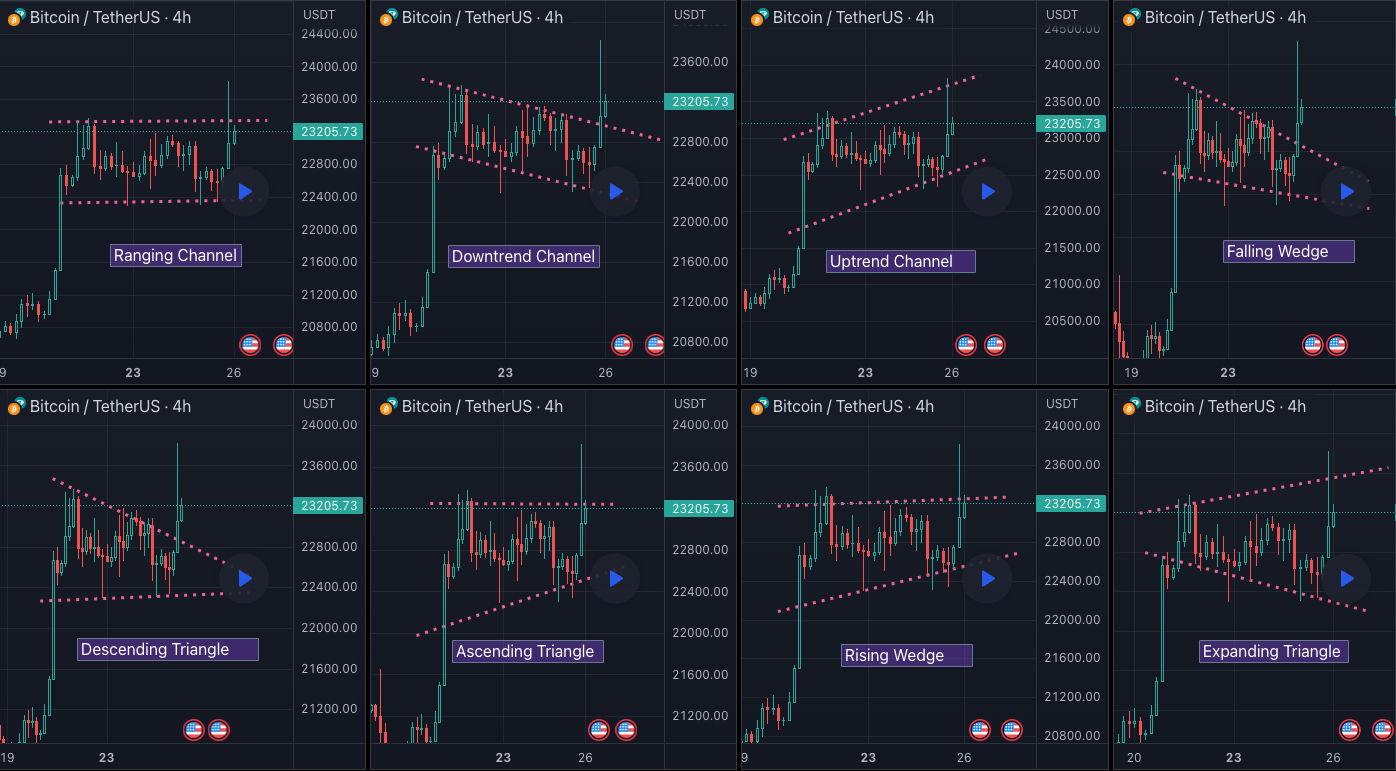
You can see that some of the patterns here are considered bullish whereas some are considered bearish. If you further convert chart scale from linear to logarithmic, you will see different set of patterns or more patterns than what we have shown for the same price. Similarly changing the charts to use Heikin-Ashi Candles can lead to different outcome.
This is the outcome of drawing patterns without any clear objective rules.
The Risks and Consequences of Overfitting
The risks and consequences of overfitting in chart pattern analysis are significant. Overfit strategies often suffer from poor generalization to data. Traders will fail to distinguish between correct and incorrect patterns. When we say correct and incorrect patterns, they are nothing to do with the outcome of the trade. Even the trades made on correct patterns fail. Here we are only talking about the patterns which are objective in nature and does not depend on subjective bias of person analysing it.
This leads to inconsistent and erratic drawing of patterns over the period of time and thus an inconsistent analysis. Overall, traders will not be able to build reliable strategy on this basis as they would not know if the trades failed due to incorrect drawing of patterns or is it a genuine failed pattern.
Techniques to Avoid Fitting Patterns to Bias
Only way to overcome the risk of Drawing patterns based on bias is by defining clear and objective rules. Generally, zigzag indicator is used for algorithmic identification of patterns on the chart. One such set of rules is as described below.
- Draw zigzag on chart
- Find and draw a trend line joining 2 or more pivot lows where price has not breached the trend line towards downside.
- Find and draw a trend line joining 2 or more pivot highs where price has not breached the trend line towards upside.
- While drawing, trend lines can touch the pivot candle at any point. But, candles should not lie outside trend line.
- Take fake outs into consideration to make minor adjustments.
- At least one among the above trend line should join 3 or more pivots. Another one can have just two pivots.
Do you see clear pattern after following these steps? If yes, then you found your pattern and also a skill to define them objectively without bias.
These set of rules are one method. Traders are free to define their own methods for drawing the patterns objectively. But, it is important to backtest and collect crucial information such as win ratio, risk ward etc in the process in order to build a strong strategy.
Preprogrammed Custom Indicators for Pattern Detection
Another simple option to eliminate bias while drawing patterns is by using programmable indicators which does the initial screening of patterns. Popular charting platforms have their own built in indicators for pattern recognition. There are also custom indicators built by programmers which are available for free. Here are some of the Chart Pattern related indicators from Trendoscope which are available for anyone.